Ask LinkedIn Lindsey: Analytics & Performance Data
Jul 04, 2023
Data! Analytics! Performance! They’re all the rage these days. In every sphere of business, it seems we’re constantly talking about how to measure, make sense of, and leverage lots of information. The same is true for LinkedIn. And while I think it’s important to use the data we have available to become better, I also recognize that all the jargon can keep some from knowing where to start. That’s why, I’m answering your top LinkedIn analytics questions (and the ones you’re too embarrassed to ask) in this edition of my ongoing series Ask LinkedIn Lindsey.
Q: Where can I find LinkedIn analytics?
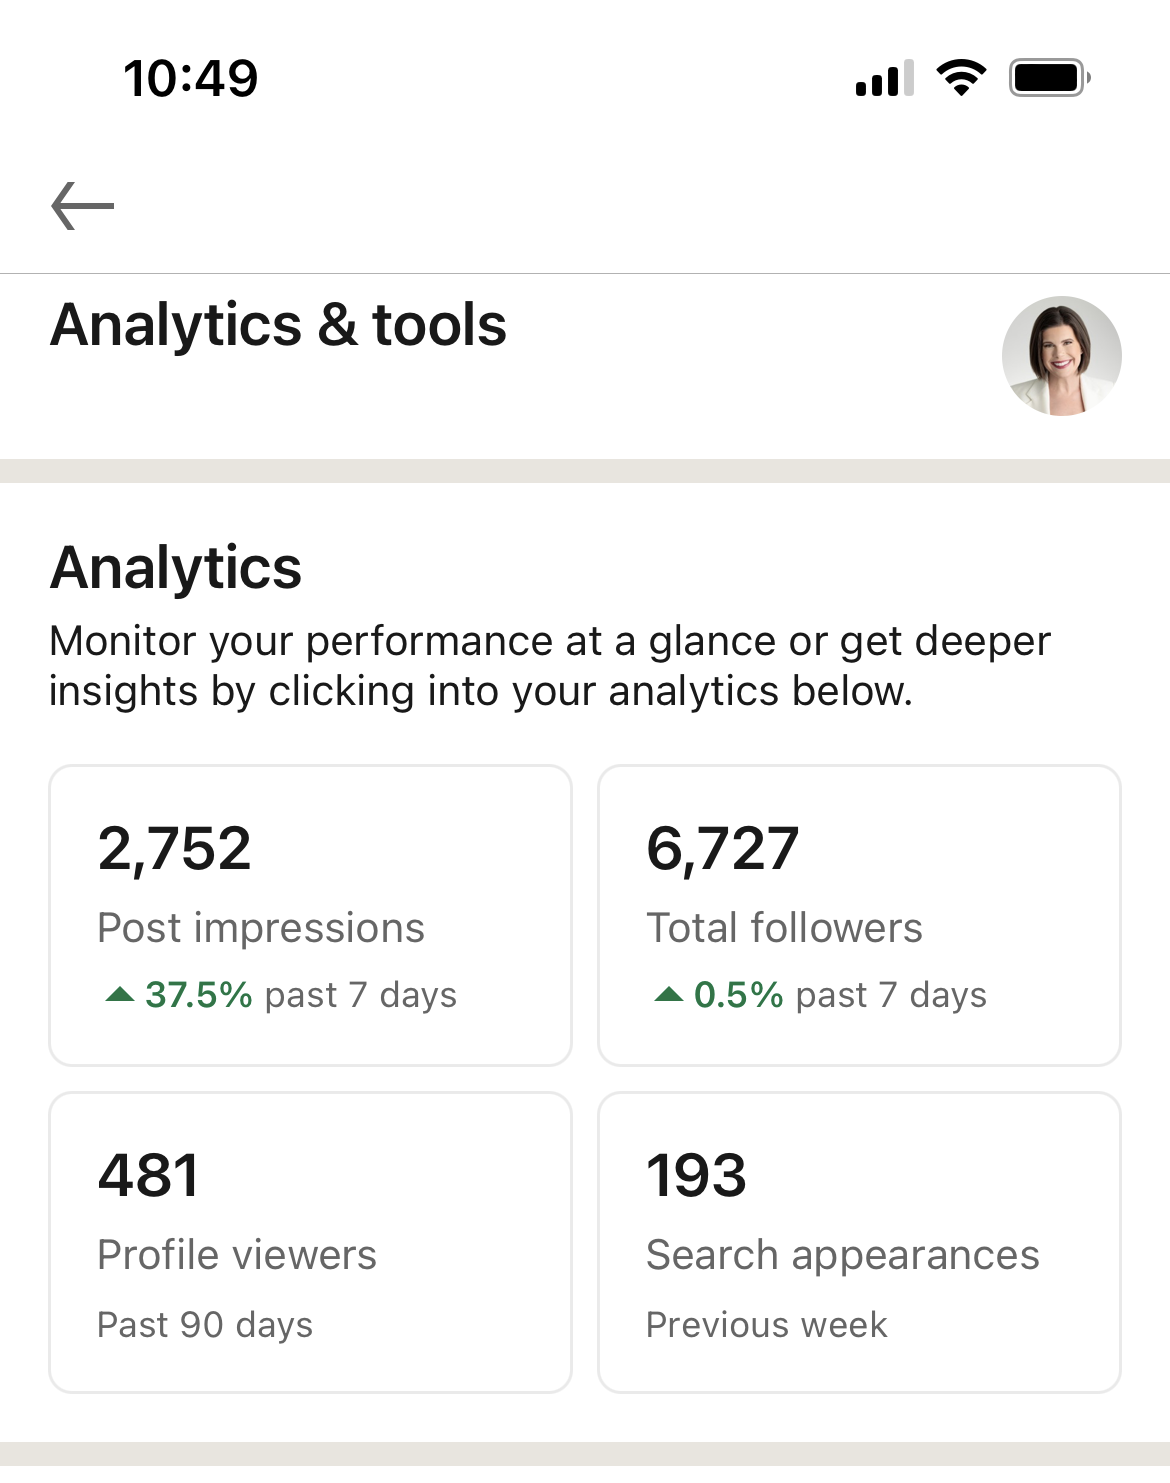
A: Great question! It depends on your settings and device. On the mobile version of LinkedIn, you can access the “Analytics & tools” by clicking your profile picture on the top left of your home page. Here’s a preview of what you’ll see once you click.

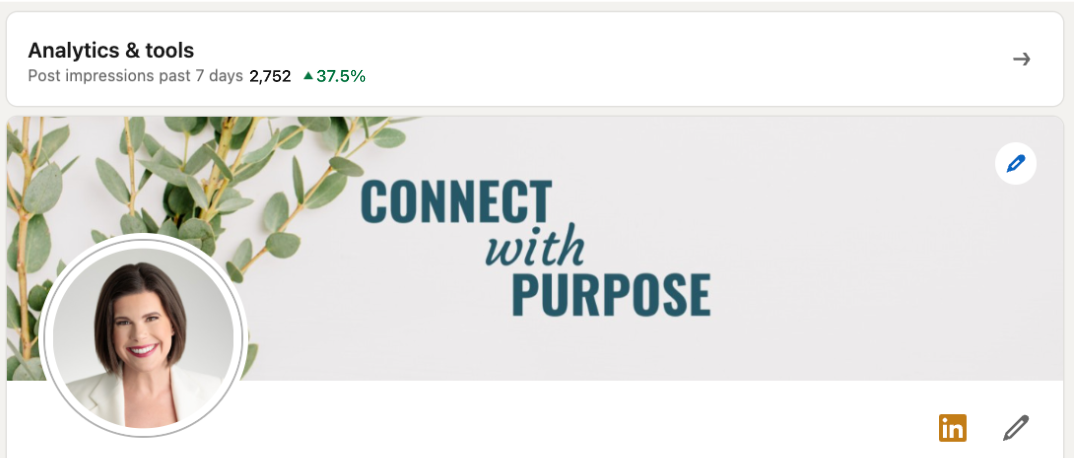
On the desktop view of LinkedIn and if you have Creator Mode turned on, you can find it via the white bar at the top of your profile page.

If you do not have Creator Mode turned on, you can find similar info in the Analytics section of your profile, nested between the anchor or headline block of your profile and the Resources block.
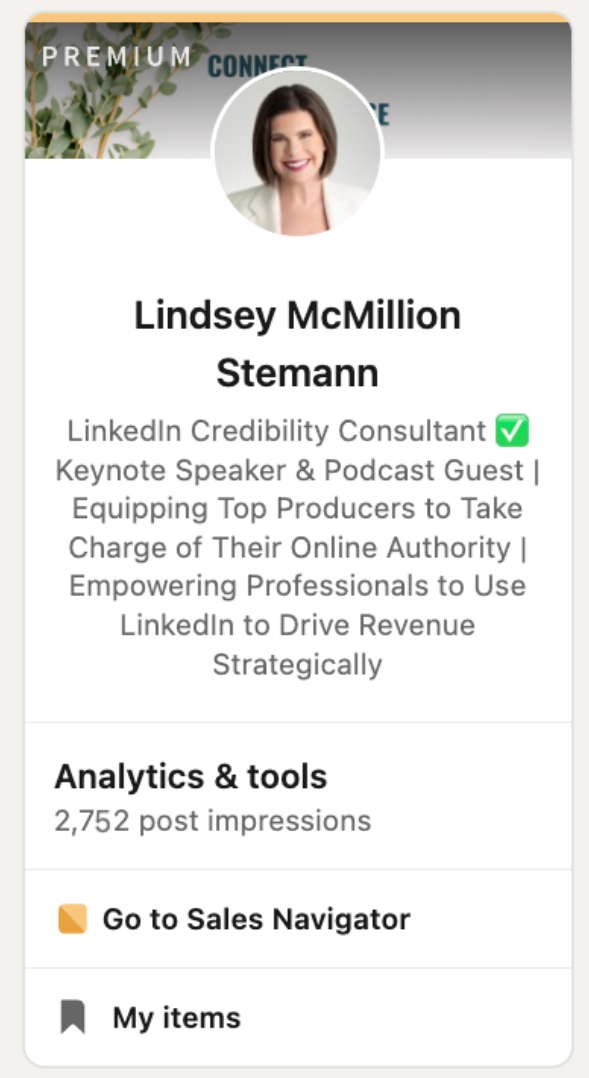
Regardless of whether you have Creator Mode turned on or off, you can always see a preview of your latest stats in the left column of your homepage on the desktop version of LinkedIn.

Dive Deeper: Not familiar with Creator Mode? Start here to learn why I recommend turning it on.
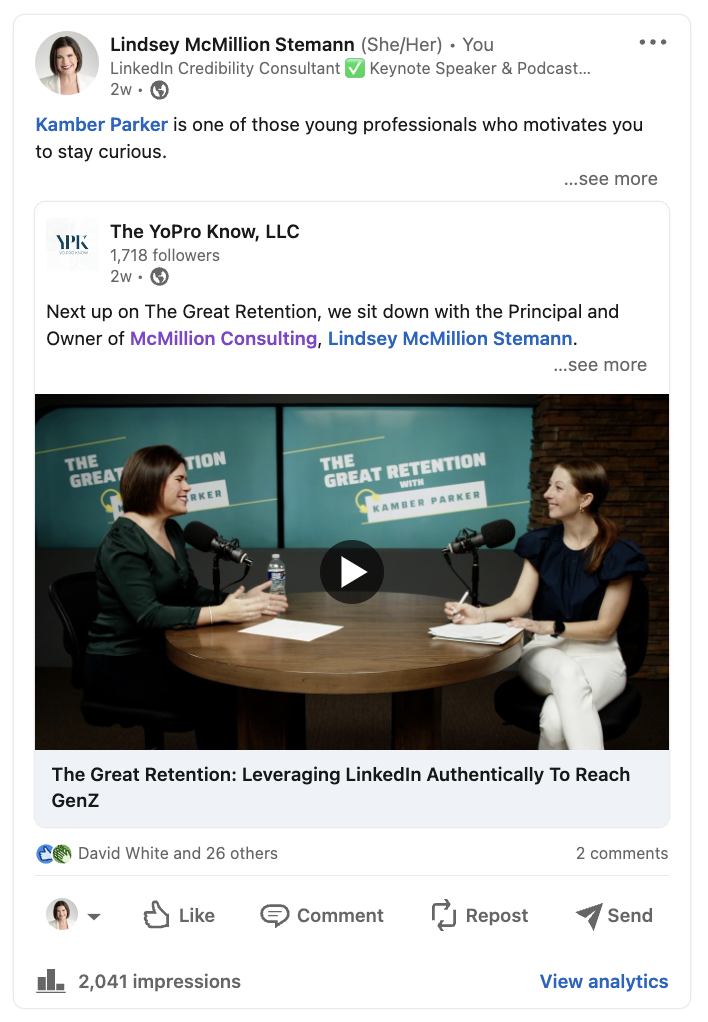
Note that you can see post-level analytics as well by clicking the blue “View Analytics” button at the bottom right of any post in the desktop version of LinkedIn.

Your social selling index (SSI), LinkedIn’s tool for measuring your influence, is also a great spot to get data on your performance. You can find your score at this link (linkedin.com/sales/ssi) if you’re logged into LinkedIn.
Dive Deeper: I’ve written several articles on LinkedIn’s SSI. Get the scoop on what it is and how to use it here or by searching “social selling index” on my LinkedInsider blog page.
Q: If I’m honest, I don’t really understand LinkedIn’s analytics terms. Help!
A: There’s no shame in that! LinkedIn terminology can get a bit confusing. Let’s define a few key terms.
- “Post impressions” refers to the number of people who have viewed your content. If you have Creator Mode turned off, your analytics summary will show you the number of impressions on your top-performing post. If you have Creator Mode turned on, your summary will show the total number of impressions you’ve received across all your posts within the last seven days. You can also click on post impressions to see a breakdown of total impressions by post. Additionally, Creator Mode allows you to see whether your post impressions have trended up or down and by what percentage in the past week.
- “Profile Viewers” refers to the number of people who clicked on your profile in the past 90 days. These people may or may not be connected with you or follow you.
- “Search Appearances” refers to the number of times your name and face showed up in search results on LinkedIn within the past week. With Creator Mode turned on, you can click into Search Appearances to see a more detailed breakdown including keywords you were found for, top companies your searchers work at, and top job titles of your searchers.
- “Total Followers” refers to the total number of people following you (not the same as those connected with you) on LinkedIn. This data point is only available to users who have Creator Mode turned on, since Creator Mode is designed to help you build a following and establish yourself as a thought leader. As with Post Impressions, the Total Followers metric also displays trend data, allowing you to gauge how quickly your following is growing and at what rate.
Q: Which data points matter most?
A: That all depends on your top LinkedIn goals. Generally speaking, I recommend keeping an eye on post impressions, profile views, and total followers. These three pieces of information are essential to understanding the size and interests of your audience.
Q: How should I leverage the data I have to improve on LinkedIn?
A: My number one recommendation is to use the data to improve your content. Get in the habit of reviewing your analytics not only overall, but also on individual posts. Impressions (number of views) and Engagements (including reactions, comments, and reposts), together give you a picture of what your audience values. Ask yourself, “What types of posts is my audience reacting to, commenting on, viewing, and sharing most?” While these metrics aren’t everything, they can help you brainstorm helpful and engaging content.
Q: Does a LinkedIn premium subscription give me more data and analytics tools?
A: The short answer is yes. You get a bit more insight with a LinkedIn premium membership, including the ability to see who’s viewed your profile up to 365 days back. While you will have more tools at your fingertips with a premium membership, that alone is not necessarily a reason to pull the trigger on a paid version. One great indicator that it’s time to upgrade is reaching the commercial search limit or if you’re ready to get serious about rolling out a new content game plan.
Dive Deeper: Not sure which LinkedIn premium plan is right for you? Use this guide to navigate all the options.
If you’re thinking about analytics and performance on LinkedIn, that’s a sign that you’re ready to use LinkedIn the right way. I want to help you do that. A great place to start is with my free Rock Your LinkedIn Profile guide. You’ll learn to prepare, build, and launch your profile so that you can mirror your stellar offline reputation online.


